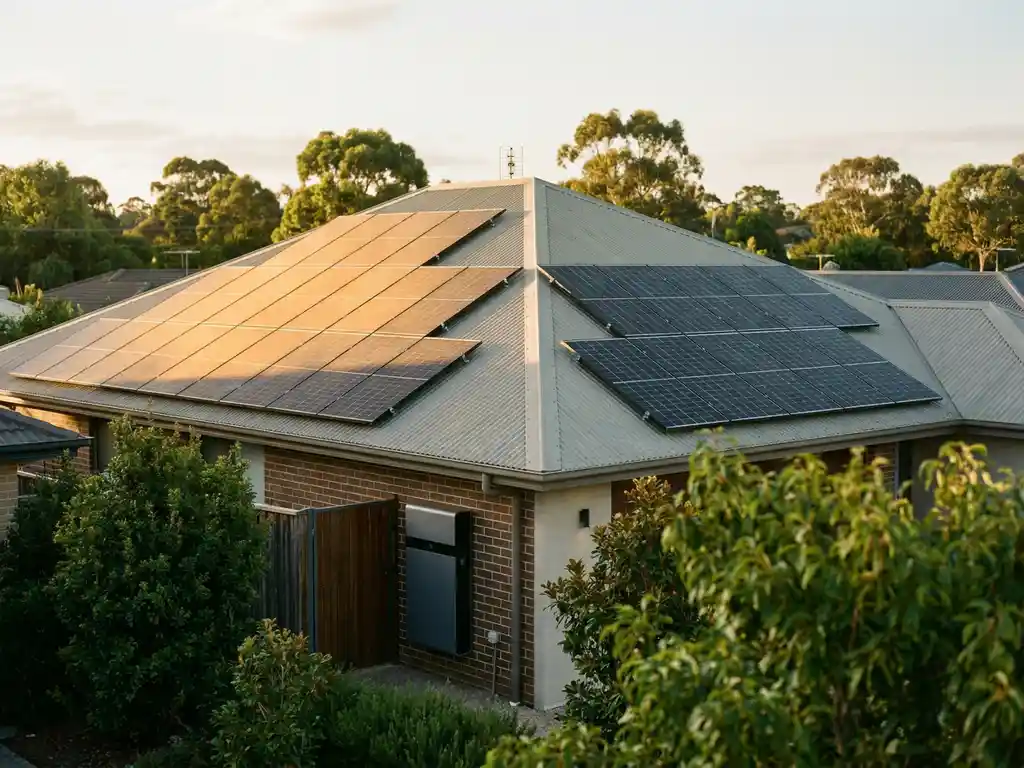
When sizing a battery system for a solar installation, the roof is rarely a neutral variable. The direction a roof faces, and the angle at which it sits, directly shape how much energy the panels produce and when that production peaks. For installation companies advising commercial clients on energy storage, understanding this relationship is not optional. It sits at the heart of every accurate battery sizing calculation, and getting it wrong leads to undersized systems that disappoint clients or oversized ones that erode project margins.
This article breaks down the technical chain from roof orientation to battery demand, and explains how modern ERP tooling can remove the manual complexity from this process entirely.
How solar yield varies by roof direction
Roof orientation is one of the primary determinants of total annual solar yield. In the Northern Hemisphere, south-facing roofs receive the most direct irradiance across the year, typically generating the highest cumulative output. East and west-facing orientations produce less total energy but spread that generation more evenly across the morning and afternoon hours. North-facing roofs in the same hemisphere receive the least irradiance and are generally considered suboptimal for solar installations, though they are sometimes used when roof area is the limiting factor.
The tilt angle compounds this effect. A south-facing roof at a 35-degree pitch will outperform the same roof at 10 or 60 degrees. When you combine orientation and tilt, you get a yield profile that is unique to each installation site. That profile determines not just how much energy is produced, but precisely when it is produced throughout the day and across seasons. This timing dimension is what connects roof direction directly to battery demand.
The link between production profiles and battery demand
Battery demand is driven by the mismatch between when solar energy is generated and when it is consumed. A production profile describes the shape of that generation curve across the day. South-facing systems typically produce a symmetrical bell curve peaking around solar noon. East-facing systems front-load generation into the morning, while west-facing systems shift the peak into the afternoon and early evening.
For a commercial client whose energy consumption is heaviest during business hours, an east-west split roof may actually deliver better self-consumption rates than a pure south-facing array, because generation aligns more closely with load. However, where generation and consumption remain misaligned, a battery bridges the gap. The wider and more frequent that gap, the greater the battery capacity required. This is why two installations with identical panel counts but different roof orientations can demand significantly different battery sizes. A reliable solar battery calculator must account for this production curve, not just total kilowatt-hour output.
Key variables that feed into the battery sizing calculation
Accurate battery sizing draws on several interconnected inputs. Roof orientation and tilt establish the production profile, but additional variables refine the calculation considerably.
- Annual and daily energy consumption: The total load and its distribution across hours of the day set the baseline demand the battery must serve.
- Self-consumption target: Whether the client aims to maximise grid independence or simply reduce peak import costs changes the required capacity meaningfully.
- Grid export limits: In markets like the Netherlands and Germany, grid operators sometimes restrict export, which increases the value of on-site storage and raises the optimal battery size.
- Seasonal variation: Winter months produce far less solar yield in northern European markets, affecting the ratio of battery cycling to grid dependency across the year.
- Battery round-trip efficiency and depth of discharge: Not all stored energy is recoverable. A battery rated at 10 kWh usable capacity at 90% depth of discharge behaves differently in practice than one rated at the same nominal figure with a more conservative discharge ceiling.
Together, these variables interact in ways that make manual calculation error-prone, particularly when handling multiple roof faces or complex commercial load profiles. This is where a structured battery capacity calculator built into the project workflow delivers real operational value.
Practical sizing outcomes for common roof configurations
Translating orientation data into sizing outcomes requires thinking through a few common scenarios that installation companies encounter regularly.
South-facing roofs
A south-facing roof concentrates generation around midday. For clients with low daytime consumption, such as residential properties or offices with flexible working patterns, a significant portion of that midday peak goes unused without storage. Battery sizing here focuses on capturing the surplus midday generation and shifting it to evening demand. The calculation is relatively straightforward because the production curve is predictable and well-documented.
East-west split configurations
East-west roofs spread generation across a longer daily window, which often reduces the peak surplus at any single point. This can mean a smaller battery achieves a similar self-consumption rate compared to a south-facing system of equal capacity. However, the calculation becomes more complex because two distinct production curves must be modelled and combined before the battery demand can be assessed accurately.
Multi-pitch commercial roofs
Large commercial installations frequently involve multiple roof sections at different orientations and pitches. The combined production profile is a composite of all contributing surfaces, and the battery sizing must reflect the aggregate curve rather than any single face. Getting this right at the quotation stage prevents costly system revisions after installation.
How ERP software automates orientation-based battery calculations
Manual battery sizing is time-consuming and introduces risk at the quotation stage. When a project manager must pull orientation data, model production curves, factor in consumption profiles, and apply battery efficiency parameters by hand, the process is slow and the margin for error is high. At scale, across dozens of concurrent projects, that risk compounds quickly.
Modern ERP platforms built for sustainable installation companies address this by embedding the calculation logic directly into the quotation and project workflow. Rather than switching between spreadsheets and standalone tools, the orientation data captured during the site survey feeds automatically into the battery sizing module. The system applies the relevant production profile, tests it against the consumption data, and outputs a recommended battery capacity alongside the supporting rationale. This tightens the link between the technical assessment and the commercial proposal, reducing revision cycles and improving quote accuracy.
This kind of integration also supports consistent methodology across a team. When multiple engineers are sizing batteries for different clients simultaneously, a centralised calculation engine ensures that the same logic and parameters are applied every time, which is critical for maintaining quality as a business grows.
How OpusFlow helps with battery sizing calculations
OpusFlow is the most complete ERP platform for sustainable installation companies, and our battery sizing tools are built directly into the project and quotation workflow. Rather than treating the battery calculator as a standalone feature, we connect it to the full commercial and operational process, so that sizing decisions flow seamlessly into quotes, purchase orders, and project planning.
- Integrated solar and battery calculator: Our battery calculator for solar accounts for roof orientation, tilt, consumption profiles, and grid constraints to produce accurate capacity recommendations at the quotation stage.
- PV-Designer tool: Our built-in PV design environment captures roof geometry and orientation data that feed directly into the battery sizing logic, eliminating manual data transfer between tools.
- Automated quotation generation: Once the sizing calculation is complete, the output connects directly to the quotation module, reducing the time from site survey to signed proposal.
- AI-powered workflow automation with Toni: Our AI agent Toni can automate follow-up tasks, flag calculation anomalies, and support project teams in managing multiple sizing assessments simultaneously without adding headcount.
- Multi-market support: With clients across the Netherlands, Germany, Spain, and Belgium, our platform handles the grid export rules and irradiance profiles relevant to each market out of the box.
For installation companies looking to improve accuracy, reduce revision cycles, and scale their battery project pipeline without proportionally increasing their back-office workload, OpusFlow provides the infrastructure to make that possible. Get in touch with our team to see how the platform fits your current workflow.
Related Articles
- What does a professional battery proposal include?
- What is the relationship between solar panel kWp and battery storage kWh?
- How does a home battery work together with an EV charger?
- What is the best way to manage field crews and office staff in one system?
- How does ERP software help with warranty tracking for installation work?